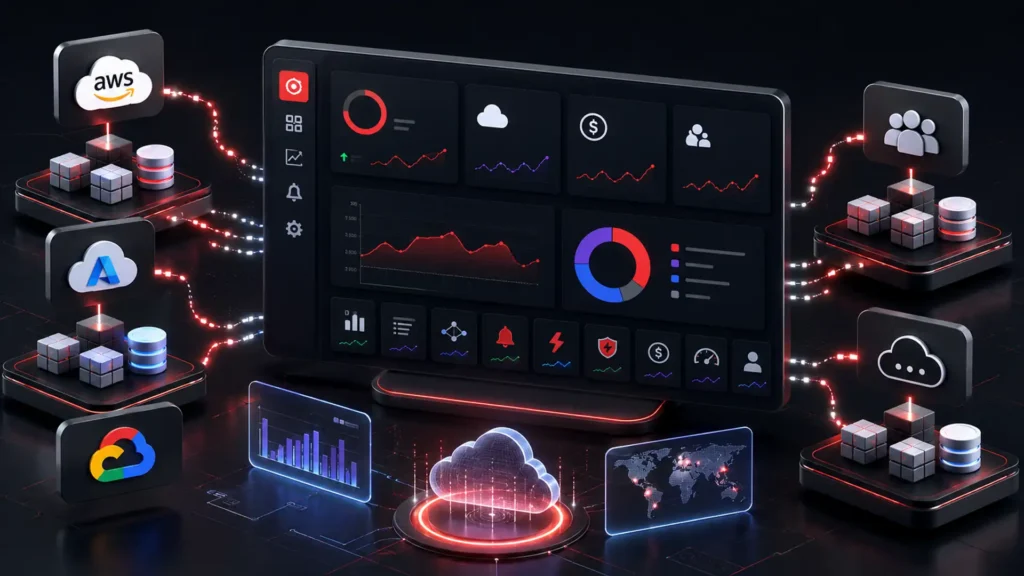
Cloud monitoring is the continuous observation of cloud infrastructure to understand its state, behaviour and change. In single-account environments it is largely a solved problem. Across dozens or hundreds of accounts it becomes something else — an aggregation problem, where the constraint is not collecting signal but deciding which signal deserves attention.
Anyone running a multi-account estate has met the failure mode. Every account is monitored. Every alert channel is configured. And nobody can answer “what are the three things we should look at this morning?” without opening eleven tabs.
Why does multi-account cloud monitoring break down?
Multi-account architecture is the right pattern. AWS recommends account separation as a primary isolation boundary, and it delivers real benefits: blast-radius containment, clean cost allocation, environment separation, and regulatory segregation.
It is also now the norm rather than an advanced pattern. Flexera’s 2026 State of the Cloud Report found 73% of organisations operating hybrid estates, up three percentage points year over year, with multi-cloud adoption continuing to rise — and noted the increase may reflect mergers and siloed applications as much as deliberate strategy. In other words, a good many organisations did not choose their account sprawl; they inherited it.
It also fragments observation by design. The same boundary that isolates failure isolates visibility.
Four specific failures follow:
- Tool sprawl. Each account accumulates its own dashboards, alarms and thresholds. Configuration diverges. Nobody is certain which account is monitored to which standard. Fortinet’s 2026 cloud security research reportedly found around 69% of organisations citing tool sprawl as a barrier — meaning the response to fragmented visibility is usually another tool, which deepens the fragmentation.
- Alert volume. Fifty accounts each producing a modest daily alert stream generate a combined volume that no team reads. Alerts stop being read long before anyone admits it.
- No relative priority. An account-scoped alert cannot tell you whether it matters more than an alert in a different account, because it has no view of the other account. Everything arrives as equally urgent, which is functionally identical to nothing being urgent.
- Cross-account causality is invisible. A change in a shared services account that breaks a workload in three others presents as four unrelated incidents in four separate places.
The last point is the expensive one. Multi-account estates are interdependent — shared VPCs, transit gateways, centralised IAM, cross-account roles — but account-scoped monitoring cannot see the dependency, so root cause analysis becomes a manual correlation exercise across teams.
What is the difference between event monitoring and impact monitoring?
Event monitoring reports that something happened. Impact monitoring reports what it did.
| Event monitoring | Impact monitoring | |
| Output | A log of what occurred | A ranked set of findings |
| Volume | Scales with activity | Scales with significance |
| Prioritisation | None, or per-account only | Cross-account and relative |
| Question answered | “What happened?” | “What should I do first?” |
| Failure mode | Alert fatigue | Genuine misses if scoring is poor |
Note that impact monitoring has a real failure mode too, and it should be stated plainly: if the impact scoring is wrong, you have hidden something important behind a low priority. That is a worse failure than noise, because noise is at least visible. The mitigation is transparency — you should always be able to see the full change record behind a ranked finding, and understand why it was scored the way it was. Any tool that ranks without letting you audit the ranking is asking for trust it has not earned.
How do you consolidate cloud monitoring across AWS accounts?
AWS provides the aggregation primitives. Using them is most of the work:
- Organisation-wide CloudTrail. A single organisation trail captures API activity across every member account, including accounts added later. This matters more than it sounds — per-account trails guarantee that a newly created account is unmonitored until someone remembers it.
- AWS Config aggregators. A multi-account, multi-region aggregator centralises configuration items and rule compliance into one view.
- Delegated administrator accounts. Security Hub, GuardDuty and Config all support organisation-level delegated administration, so findings roll up rather than sitting in the account that generated them.
- Consistent tagging, enforced. Cross-account reporting is only as good as the tags it groups by. Tag policies and SCPs are what make this real; documented tagging conventions without enforcement do not survive a busy quarter.
- A prioritisation layer above the aggregation. Aggregation gets everything into one place. It does not decide what matters. This is the step teams underestimate, and it is the difference between one dashboard and one useful dashboard.
Steps one through four are configuration work with a clear finish line. Step five is where consolidated monitoring either becomes the morning starting point or becomes another dashboard nobody opens.
What should a consolidated cloud dashboard actually show?
Judged by the question “does this change what I do next?”, a genuinely useful multi-account view surfaces:
- Cross-account findings ranked by assessed impact — not grouped by account, which just recreates the fragmentation in one window
- Attribution on every change — identity, role and origin mechanism, resolved consistently across accounts
- Cost deltas alongside configuration changes, so a change and its financial consequence appear together rather than in separate tools a month apart
- Change velocity per account against its own baseline, since a busy dev account and a locked-down production account have different normals
- Compliance deviations mapped to the framework they affect, so a finding is already halfway to being audit evidence
- Aggregate posture trend, to answer whether the estate is improving or degrading over time — the question executives actually ask and the one most dashboards cannot answer
What it should not show is a scrolling feed of everything that happened. That artefact exists in every organisation and is read by no one.
Why does multi-account cloud monitoring matter more for MSPs?
Because for a managed service provider the multiplier is client count, not account count, and every structural problem above gets worse.
A provider running twenty clients across six accounts each is monitoring 120 accounts under different contracts, different compliance obligations, different change windows and different escalation paths. Three additional constraints apply:
- Client isolation. Findings must aggregate for the operations team while remaining strictly separated per client for reporting and access.
- Evidence as a deliverable. For an MSP, change records are not internal hygiene — they are contractual proof of service. “We detected and remediated this within the window” needs a record, per client, on demand.
- Margin sensitivity. Manual review does not scale with client count. Every hour spent correlating events across tabs is unbillable, and it is the line item that decides whether the practice is profitable at scale.
The market is moving in a direction that sharpens all three. Flexera’s 2026 report describes MSPs as remaining critical for managing cloud complexity, with roughly two-thirds adopting AI for cybersecurity and nearly half planning to add AI consulting or SaaS management services — while noting that customers are retaining greater ownership of governance and cost accountability themselves. That combination raises the bar. A client who owns their own governance function will notice whether the change record you hand them is genuinely prioritised or just an export.
This is the pattern Cloudeva.ai is built for — aggregating change, attribution and impact across every account into one prioritised view while preserving per-client separation. It is also the environment it came from: Cloudeva.ai was built by Rapyder Cloud Solutions, an AWS Premier Tier Services Partner, out of the operational problem of governing large multi-account estates on behalf of clients.
Frequently asked questions
How do you build an AWS multi-account dashboard?
Aggregate at the organisation level first — an organisation-wide CloudTrail, an AWS Config multi-account aggregator, and delegated administrator accounts for Security Hub and GuardDuty. Then add a prioritisation layer that ranks findings by impact across accounts, because aggregation alone produces a single large feed rather than a usable view.
What is the best MSP cloud management platform approach?
One that aggregates findings for the operations team while keeping client data separated for reporting and access control, and that produces per-client evidence as an export rather than a manual exercise. Prioritise attribution and impact assessment over alert breadth — MSP teams are constrained by review time, not by signal availability.
Does AWS Organizations monitoring give cross-account visibility natively?
Partly. CloudTrail organisation trails, Config aggregators and delegated administration for Security Hub and GuardDuty all support multi-account collection. What native services do not provide is cross-account impact prioritisation, change attribution with cost context, or per-account velocity baselining.
How many AWS accounts is too many to monitor manually?
There is no fixed threshold, but manual review typically breaks somewhere between ten and twenty active accounts — the point at which reading every day’s changes exceeds the time available. The clearer signal than account count is behavioural: if the team has stopped reading the alert feed, manual review has already failed.
What is the difference between cloud monitoring and cloud governance?
Monitoring observes what is happening. Governance decides what should be allowed to happen and proves that the rules held. Monitoring supplies the evidence governance depends on, which is why monitoring built only for uptime rarely satisfies an auditor.
One prioritised view across every account, with impact already assessed. See Cloudeva.ai →